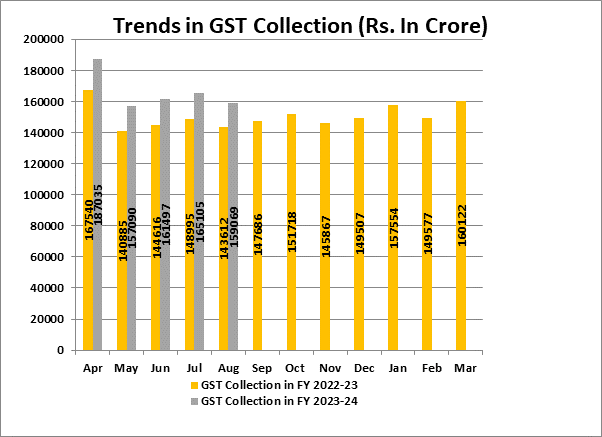
The gross GST revenue collected in the month of August, 2023 is ₹1,59,069 crore of which CGST is ₹28,328 crore, SGST is ₹35,794 crore, IGST is ₹83,251 crore (including ₹43,550 crore collected on import of goods) and Cess is ₹11,695 crore (including ₹1,016 crore collected on import of goods).
The government has settled ₹37,581 crore to CGST and ₹31,408 crore to SGST from IGST. The total revenue of Centre and the States in the month of August, 2023 after regular settlement is ₹65,909 crore for CGST and ₹67,202 crore for the SGST.
The revenues for the month of August, 2023 are 11% higher than the GST revenues in the same month last year. During the month, revenue from import of goods was 3% higher and the revenues from domestic transactions (including import of services) are 14% higher than the revenues from these sources during the same month last year.
The chart below shows trends in monthly gross GST revenues during the current year. The Table-1 shows the state-wise figures of GST collected in each State during the month of August, 2023 as compared to August, 2022 and Table-2 shows the SGST and SGST portion of the IGST received/settled to the States/UTs in August, 2023.

Table-1: State-wise Y-o-Y growth of GST Revenue in August, 2023[1] (Rs. In crore)
State/UT | August’22 | August’23 | Growth(%) |
Jammu and Kashmir | 434 | 523 | 21 |
Himachal Pradesh | 709 | 725 | 2 |
Punjab | 1651 | 1813 | 10 |
Chandigarh | 179 | 192 | 7 |
Uttarakhand | 1094 | 1353 | 24 |
Haryana | 6772 | 7666 | 13 |
Delhi | 4349 | 4620 | 6 |
Rajasthan | 3341 | 3626 | 9 |
Uttar Pradesh | 6781 | 7468 | 10 |
Bihar | 1271 | 1379 | 9 |
Sikkim | 247 | 320 | 29 |
Arunachal Pradesh | 59 | 82 | 39 |
Nagaland | 38 | 51 | 37 |
Manipur | 35 | 40 | 17 |
Mizoram | 28 | 32 | 13 |
Tripura | 56 | 78 | 40 |
Meghalaya | 147 | 189 | 28 |
Assam | 1055 | 1148 | 9 |
West Bengal | 4600 | 4800 | 4 |
Jharkhand | 2595 | 2721 | 5 |
Odisha | 3884 | 4408 | 14 |
Chhattisgarh | 2442 | 2896 | 19 |
Madhya Pradesh | 2814 | 3064 | 9 |
Gujarat | 8684 | 9765 | 12 |
Daman and Diu and Dadra and Nagar Haveli | 311
| 324
| 4
|
Maharashtra | 18863 | 23282 | 23 |
Karnataka | 9583 | 11116 | 16 |
Goa | 376 | 509 | 36 |
Lakshadweep | 0 | 3 | 853 |
Kerala | 2036 | 2306 | 13 |
Tamil Nadu | 8386 | 9475 | 13 |
Puducherry | 200 | 231 | 15 |
Andaman and Nicobar Islands | 16 | 21 | 35 |
Telangana | 3871 | 4393 | 13 |
Andhra Pradesh | 3173 | 3479 | 10 |
Ladakh | 19 | 27 | 39 |
Other Territory | 224 | 184 | (18) |
Center Jurisdiction | 205 | 193 | (6) |
Grand Total | 100526 | 114503 | 14 |
Table-2: Amount of SGST & SGST portion of IGST settled to States/UTs in August, 2023 (Rs. In crore)
State/UT | SGST collection | SGST portion of IGST | Total |
Jammu and Kashmir | 220 | 420 | 640 |
Himachal Pradesh | 182 | 210 | 392 |
Punjab | 603 | 1,201 | 1,804 |
Chandigarh | 51 | 119 | 171 |
Uttarakhand | 382 | 255 | 637 |
Haryana | 1,585 | 1,094 | 2,679 |
Delhi | 1,113 | 1,209 | 2,322 |
Rajasthan | 1,265 | 1,730 | 2,994 |
Uttar Pradesh | 2,378 | 3,165 | 5,544 |
Bihar | 654 | 1,336 | 1,990 |
Sikkim | 42 | 43 | 85 |
Arunachal Pradesh | 40 | 100 | 140 |
Nagaland | 23 | 59 | 82 |
Manipur | 21 | 62 | 83 |
Mizoram | 17 | 54 | 72 |
Tripura | 36 | 84 | 120 |
Meghalaya | 50 | 86 | 136 |
Assam | 440 | 691 | 1,131 |
West Bengal | 1,797 | 1,516 | 3,313 |
Jharkhand | 802 | 120 | 922 |
Odisha | 1,333 | 401 | 1,734 |
Chhattisgarh | 710 | 488 | 1,198 |
Madhya Pradesh | 978 | 1,447 | 2,425 |
Gujarat | 3,211 | 1,723 | 4,933 |
Dadra and Nagar Haveli and Daman and Diu | 51 | 40 | 90 |
Maharashtra | 7,630 | 3,841 | 11,470 |
Karnataka | 3,029 | 2,627 | 5,656 |
Goa | 174 | 111 | 285 |
Lakshadweep | 0 | 2 | 2 |
Kerala | 1,035 | 1,437 | 2,472 |
Tamil Nadu | 3,301 | 2,212 | 5,513 |
Puducherry | 43 | 51 | 94 |
Andaman and Nicobar Islands | 10 | 22 | 33 |
Telangana | 1,439 | 1,746 | 3,186 |
Andhra Pradesh | 1,122 | 1,481 | 2,603 |
Ladakh | 14 | 43 | 57 |
Other Territory | 13 | 182 | 195 |
Grand Total | 35,794 | 31,408 | 67,202 |
**
